


Graphing software for science (OSX focus)

High quality graphical figures of your data should always be a priority when you are preparing a manuscript or presentation. If your audience doesn't understand your data because it is poorly presented, they are unlikely to grasp the 'significance' (pardon the pun) of your research.
It is important to choose a suitable graph format and represent your data in the clearest way possible. There are countless ways of representing data sets and the nature of your graph, and choice of graphing software, will be dependent on your field of research. Depending on your data, you may wish to produce a scatter plot, bar graph, piechart or multivariable 3-dimensional plot. The type of graphical software that you settle on will be dependent on the output that you wish to generate.
Below are a few OSX scientific graphical packages with some comments and links (hover over the image to find out more). If you use an alternative Mac based graphing program, please feel free to add to the list (with any insights) in the comments section below.

Microsoft office is still considered the mainstay office program and thus many people have access to Excel for graphing purposes. While excel is excellent for handling simple data sets, conducting routine calculations and plotting data during a research project it has a lack of graph types, formatting and output options. Generally, researchers use this alongside a scientific graphing program.

Powerful 2D plotting software. Interface allows a high degree of graph customisation and formatting with realtime updating. The software includes curve fitting and regression functions. Clean graphical output in multiple format types.

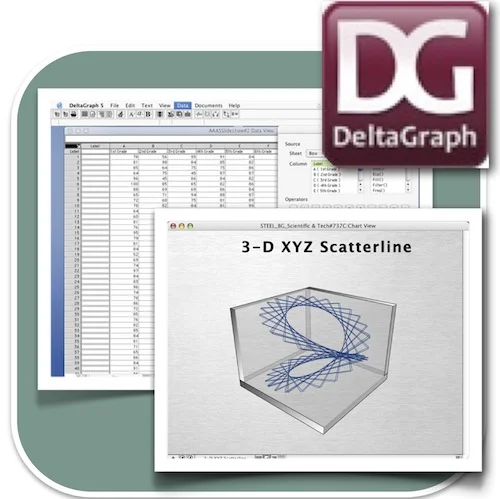
Big brother of DataGraph. 2D and 3D plotting environment with '80 data types to handle data with around 2,000 computational actions and seven different drawing environments to handle graphs'.
2D and 3D graphing software. Easy to use interface with Panatone colour matching and various output options. Images can be exported in a number of formats.
When choosing a package it is important to consider a few things. These include (1) usability and (2) output formats.
For usability, a key area to consider is the user interface and specific functions that you need from the software package. Output formats are another important aspect of your software choice. The majority of scientific journals have very specific outlines on how graphical images are submitted. Subsequently, you need to check the formats that your software can output.
- Do you require your plots to be updated in real-time?
- Are you happy using a command line interface?
- Do you require advanced data analysis features or programable functions?
- Do you want your graphs embedded within a data sheet or on a separate page?
- Do you need pixel or vector based output formats?
- Do you require video format output?
- Do you require fine control over image size and pixel resolution?
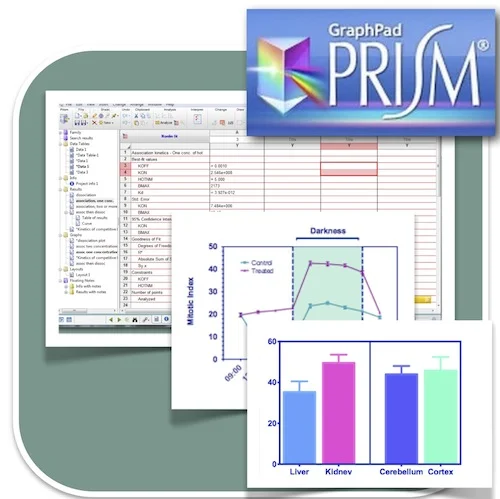
Considered by many in the biomedical field to be the 'gold standard' graphing program. Originally designed for experimental biologists, Prism can produce a number of 2D graphs and has a statistical analysis and regression functions built in. Prism graphs have a distinct look and can be exported in a number of formats suitable for publication.

Produces 2D and 3D plots. Targeting science and engineering disciplines with a number of signal processing, curve fitting and peak analysis options. Particularly useful for analysis and presentation of 3D volumetric data (i.e from MRI or CT data). Additional C and C++ programming interface, data acquisition and third party plugins.

2D scientific graphing software. Many plot types and output options. Fine control over presentation and extensive curve fitting functions. Formulas are available in the data sheet and standard templates can be constructed.

Cross platform graphing software based on Java for plotting X-Y graphs. Non-linear curve fitting and multiple output options.
Ultimately, you may need to settle on more than one package. Many labs use multiple programs depending upon their project requirements. For Apple Mac users, there are a multitude of scientific graphing programs available with a wide range of features and pricing ranges. For ECRs in academia, many packages offer academic discounts and free trials! Finally, remember, that the cost of these packages will always be less than the cost of 'your time' and the cost of 'your research'!

D plotting software with multiple output options. User interface is a little complex but quite powerful.
Other programs to consider:
This article was brought to you by ECR2STAR. If you would like to contribute to the ecr2star.org community by submitting an article, please contact us via info@ecr2star.org